Cryptocurrencies: 852,553
Exchanges: 1,057
Market Cap: $2,447,843,120,991
24h Vol: $131,097,503,122
BTC Dominance: 51.58%
ETH Gas: 9 Gwei

Bitcoin’s 200 Day Moving Average
A 200 day moving average is a common metric used in technical analysis to give some insight into the price of a commodity, security, or other financial asset.
In this article, we will discuss everything you need to know about the 200 day moving average of bitcoin. That includes what exactly the 200 day moving average is, how to calculate it, and why it is oh so important for technical analysis.
What Is The Bitcoin 200 Day Moving Average?
The Bitcoin 200 day moving average is exactly what it sounds like. It’s a line on a chart that shows the average price of bitcoin over the past 200 days.
It’s pretty simple in that regard.
Now, calculating the bitcoin 200 day moving average is a little more complicated than doing it for a stock because the bitcoin market never closes. But a price is picked for the day and that is the one used for the day.
The next section will cover wh the 200 day moving average is such an important metric.
Why Is the Bitcoin 200 Day Moving Average Important?
The 200 day moving average is, in our opinion, the most important metric for technical analysis. This is because the line often serves as either a support or a resistance line.
For those that don’t know, a support line means the price will not fall below the line. The price will not rise above a resistance line.
The 200 day moving average can serve as both depending on the price of bitcoin in relation to the line.
More interestingly, the 200 day moving average offers some insight into where bitcoin is trending. It can show you the general direction that the price is going.
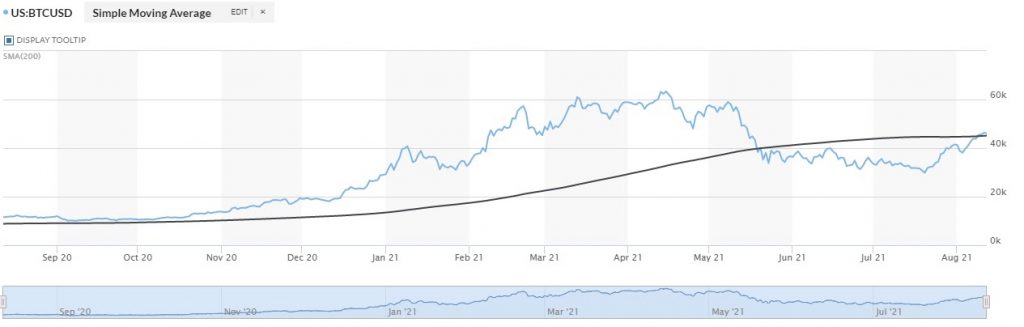
The above chart shows the price in blue and the moving average in purple. As you can see, the 200 day moving average served as a support line from September 2020 to May 2021. It then switched over to a resistance line.
Fortunately, it does appear that the 200 day moving average is moving back to a support line, which means that a price increase in bitcoin might be in the future.
How To Use The 200 Day Moving Average to Make Money with Bitcoin?
It is certainly possible to make money by using the 200 day moving average to time your trades into bitcoin. The basic premise would involve purchasing bitcoin when the price line is level with the 200 day moving average.
This is because that indicates the price is relatively flat, which is rare for bitcoin. That usually means the price will increase in the future because it likely won’t drop below the 200 day moving average.
You should also take interest when the price of bitcoin is under the 200 day moving average as this means it will often rise a little bit to reach the 200 day moving average.
To summarize, use the 200 day moving average as a sort of equilibrium price point for bitcoin. If the price is too far outside the 200 day moving average, then it will likely return back to the average. Albeit it could just plateau and the moving average could catch up to the price – it is something as volatile as cryptocurrency.
When to Sell Your Bitcoin
First, we are of the opinion that you should try to hold your bitcoin for as long as possible. However, if you do want to sell it, then the best time is when the price is above the 200 day moving average.
Now, the price is often above the 200 day moving average, so that does not help too much. What you want to look for is when the price is significantly higher than the 200 day moving average compared to previous times over the past six months.
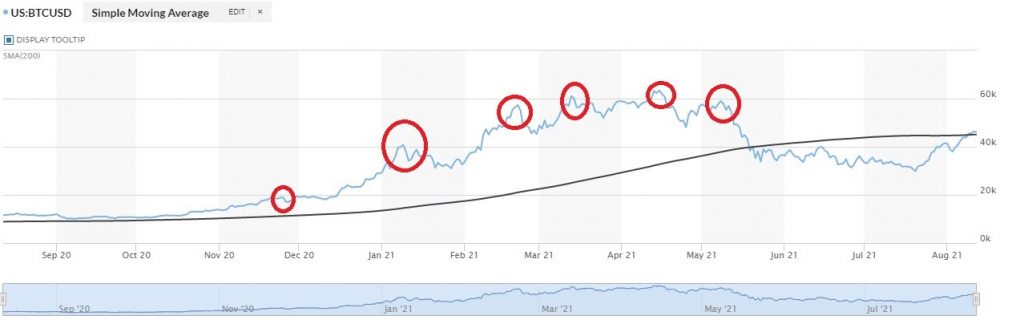
The above chart shows that selling at relative peaks above the 200 day moving average will not maximize your profit. It really demonstrates the difficulty of timing an exit from the market based on data.
You may have noticed that simply holding the bitcoin would be more profitable than selling it at every peak. And you will most likely not be able to sell it at the local peak required to maximize profit.
Using The 200 Day Moving Average to Dollar Cost Average
A relatively popular strategy with the 200 day moving average is to use it for dollar cost averaging rather than trading.
For instance, if you see that the moving average shows that it’s a good time to buy, then you should buy some bitcoin.
This does not mean you have to dump all your money into it, though. Instead, you could buy a small amount of bitcoin each week by dollar cost averaging. This gets a more even price and avoids a lot of the psychological stress from “missing out” on a low price.
We will put it this way – you should always use dollar cost averaging when purchasing bitcoin. It is a long term winning position to take, but do make sure to do it consistently. All we are trying to say with this point is that you might find it more profitable to invest a little more when the charts technical analysis indicates it’s a good time to buy.
Is Crypto Technical Analysis Profitable?
Technical analysis (TA) for crypto trading is profitable for some people and unprofitable for some people. A lot of the profitability depends on the data, trading model, and your own emotional control over your trades.
Basically, what we are trying to say is that you can make money with technical analysis, but it will take a lot of work and strategizing. And you will almost certainly use the 200 day moving average in any technical analysis of bitcoin.
Final Thoughts
That covers it for all you need to know about Bitcoin’s 200 day moving average. It’s an important metric to track if you are interested in trading bitcoin, but it becomes less relevant the longer you plan on holding your bitcoin.
Some bitcoin holders plan on holding it for a decade or more. In that case, the 200 day moving average is almost entirely irrelevant. However, if you plan on turning a profit by trading bitcoin, then you will likely have to know about the 200 day moving average.
Related Articles
Binance to Launch New Fiat-to-Digital Asset Scheme in Latin America
MONTEVIDEO, Uruguay – Binance announces the launch of a new fiat-to-cryptocurrency entry in Latin America to allow users in Argentina and Brazil for direct trading....
Familiar Places Where Using Bitcoin Is Common
The involvement of new technology receives fast acceptance if it provides good news in increasing business. Bitcoin is now universally accepted, and it comes with...
What is Behind the Crypto Market Dip in 2022?
The crypto market has recently experienced a rather dramatic dip down to $37,000 from $55,000. This drop came about rather quickly and caught many people...