Cryptocurrencies: 852,598
Exchanges: 1,065
Market Cap: $2,446,897,525,476
24h Vol: $76,202,036,117
BTC Dominance: 50.78%
ETH Gas: 7 Gwei

What is An AB=CD Pattern | How to Use It
Nowadays, many investors and traders rely entirely on these chart patterns. The AB=CD pattern can help traders identify trading opportunities. Some of them are even combined with technical indicators. This way, investors can have greater insight. So. do you want to learn what an AB=CD pattern? If the answer is yes, then keep on reading this article with concentration.
What is an AB=CD Pattern?
Generally, an AB=CD is an original harmonic pattern, which was developed by H.M. Gartley back in 1932. They became popular after H.M.Gartley published his book, Profits in the Stock Market. Since then, the AB=CD pattern is the most popular harmonic chart. Currently, there are many kinds of AB=CD model.
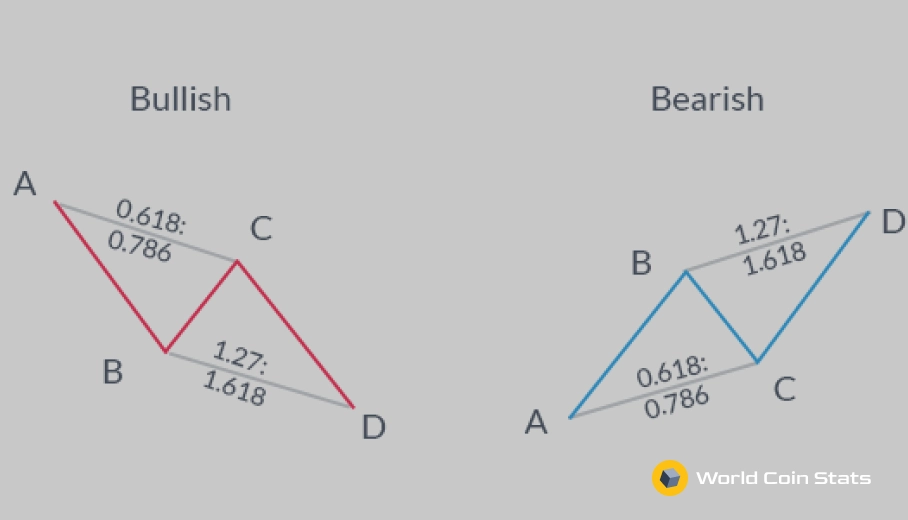
As the AB=CD pattern is a reversal pattern, it can help traders predict when the price is about to change direction. Moreover, the pattern can be used to predict bearish or bullish movements. Further, it consists of three legs. The AB, CD, and CD lines are called “legs” of the pattern. Further, the line BC is known as a correction or a retracement.
Meanwhile, the lines AB and CD tend to have the same size. Also, the A to B leg is the initial move higher or lower. Typically, a bullish AB=CD pattern acts on a downtrend, and it means a reversal to the upside. On the other hand, a bearish AB=CD pattern is made after an uptrend potential bearish reversal.
How to Use the Pattern
The most essential thing to keep in mind is that you can evaluate the trade only after the price reached point D. Also, this is your go-to for entering the trade. Moreover, in a bullish AB=CD pattern, C should be at a lower position than A and could be the average high after the low at B. In this process, Point D must be at a new low below B. Further, whenever the market reaches a point where D may be situated, don’t rush into a trade.
So, when the trending pattern is at a higher level, you can look to sell or enter a short position at Point D. However, if at a time the pattern is getting lower, you can look to buy at Point D. Furthermore, stop-loss points are well placed above or below the Point D. This also depends on the direction of the trade.
Further, typically, take-profit points are placed using Fibonacci levels. For instance, if a trader wants to move back to the original point A and move a trailing stop-loss to 28.2%, 50%, and 61.8% Fibonacci levels along the way.
Example of the AB=CD Pattern
If you want to earn money while following the AB=CD pattern, then there are target levels. For example:
TP1: 38.2% with the retracement of AD
TP2: 61.8% with the retracement of AD
TP3: point A
If the price increases fast to TP1, then it would likely continue towards TP2 as well. On the other hand, if the price is slow to get to TP1, the odds are that it will be the only TP level you will get. However, there were many cases where the market reversed after the AC=CD pattern going beyond point A.
Bottom Line
As many investors use this pattern, it would be safe to say that you should probably learn how to use it yourself. However, we recommend using the AB=CD pattern as well as other tools for technical analysis. Further, timeframes are crucial when it comes to resistance levels, so don’t forget to use them.
Related Articles
3 Top Penny Stocks To Buy in 2019
Penny stocks tend to be riskier and more volatile than other types of stocks. However, in 2019, experienced investors are interested in them. Why? Penny...

As US-China Trade Deal Continues, Oil Prices Drop from its 2-Month High
UNITED STATES – Oil prices are now being pulled back from its highest levels for almost two months due to the doubts that the trade...

ComScore Stock’s High Price at 23.89; Low Price at 1.43
USA – comScore (TSX: SCOR) is predicted to reach the value at CAD 4.9 in one year as per analysts. Moreover, 353,822 shares were exchanged,...